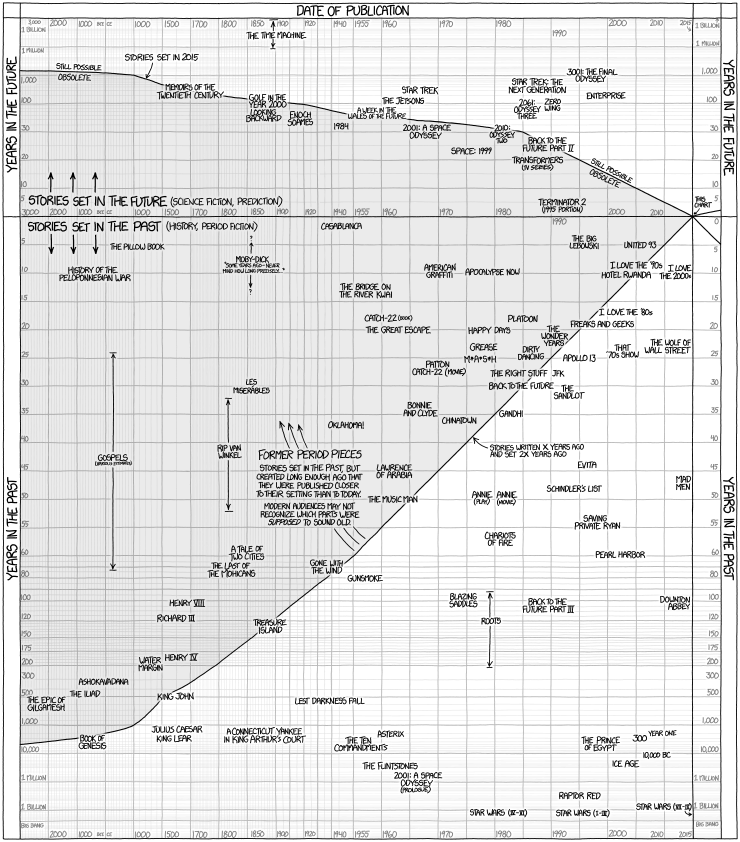
It takes a minute to figure out what you’re looking at on this graph, but once you get the point it’s quite interesting. A title’s horizontal position represents how long ago the story (novel, movie, or whatever) first appeared, with today at the right and the remote past at the left. The vertical position shows how many years into the past or future the story was set relative to when it was created.
For example, the classic film Casablanca (1942) was set only a year or so before the film’s release, so it appears about the middle of the graph horizontally and just below the line dividing settings in the past from those in the future. The more recent movie The Wolf of Wall Street (2013) is mainly set 20 or 25 years before the film’s release, so its title is almost all the way to the right and vertically between the lines for 20 and 25 years in the past.
Both axes are roughly logarithmic. That is, close to the present, each unit of distance means just a few years, but farther away from it, the same amount of distance can stand for a century, a millennium, or many millions of years, depending on how far from the axis you go. (A look at the numbers should make this clearer.)
Above the horizontal “present-day” axis is a shaded area representing times that are in the past for us today but in the future at the time the work was written.
The shaded area below the axis covers stories set in the past at the time they were published, but “created long enough ago that they were published closer to their setting than to today.”
Here’s the graph. You can click on it to see a larger version.
You can also see it at the XKCD website here: http://xkcd.com/1491/
Direct link to large version: http://xkcd.com/1491/large/
For a more detailed explanation, see the Explain XKCD website page here: http://www.explainxkcd.com/1491/. Note that in general you can usually get an explanation of an XKCD comic by typing “explain” immediately before “xkcd” in the web address (URL) and hitting return.
For my other posts referencing the XKCD web comic see this link.
In particular, here are other XKCD graphs I’ve mentioned in earlier posts:
- Rapidity of legalization of mixed-race versus same-sex marriage (link)
- Ocean depth graph (link)
- The total mass of humans, pets, and livestock versus all other land mammals (link)
- Partisan and ideological makeup of Congress (House and Senate separately) (link)
For the latest XKCD comic click here: http://www.xkcd.com

