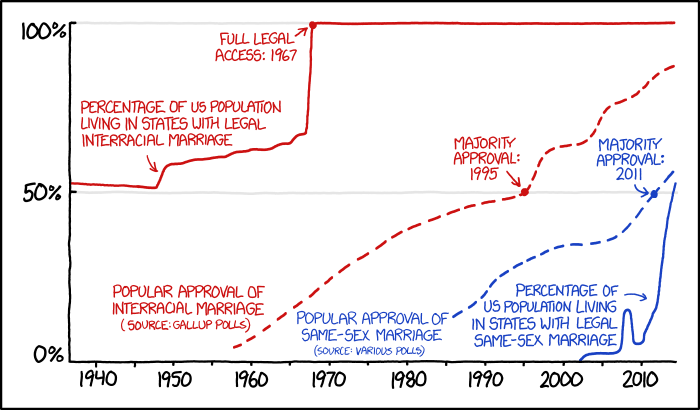
The XKCD web comic offers not just comic strips but often some quite interesting and informative graphics. Here’s yet another example:

The associated title text (what you see if you hover your mouse pointer over the image) reads, “People often say that same-sex marriage now is like interracial marriage in the 60s. But in terms of public opinion, same-sex marriage now is like interracial marriage in the 90s, when it had already been legal nationwide for 30 years.”
As the graph indicates, only about a quarter of Americans surveyed were in favor of mixed-race marriage at the time the Supreme Court legalized it in 1967 in the wonderfully named decision Loving v Virginia.
It’s interesting to compare legalization against popular support. It is probably safe to say that throughout our history, fewer Americans have supported same-sex marriage than lived in states where it was legal. (A few states never outlawed it.) But with same-sex marriage it’s the opposite: A higher fraction of Americans support same-sex marriage than live in states that permit it.
I saw that last point made here at the website explainxkcd.com, where you can find some interesting additional data.

Pingback: XKCD graph of stories set in the past and future (at the time they were published) | D Gary Grady
Pingback: When will conservative outrage of same-sex marriage subside? | D Gary Grady
Pingback: An xkcd graph from October | D Gary Grady